eNews
Fall 2020 | Vol 13 | No 4
Burn severity mapping at the national scale
The Fire Ecology Program has been collaborating with Josh Picotte and other scientists at the U.S. Geological Survey, and two universities to publish a nation-wide assessment of our ability to map the severity of wildfires and prescribed fires using satellite remote sensing technology. Josh got his professional start at Tall Timbers in 2006, and since then has become a national leader in the field of remote sensing of burn severity. While at Tall Timbers, he focused on measuring burn severity, or the degree of change in vegetation and soil caused by fire, in plots on the ground, to calibrate data collected by satellites to map out burned areas in the southeastern U.S. For the current research, such plots have been compiled from around the country, totaling 5850 plots collected following 231 fires.
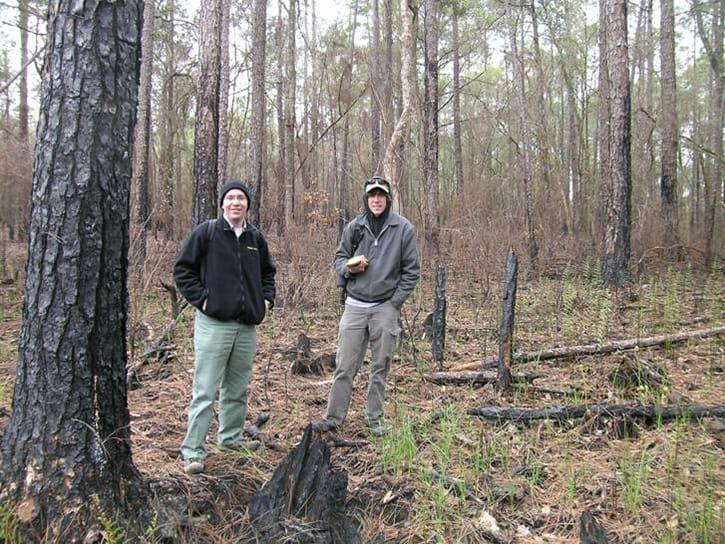
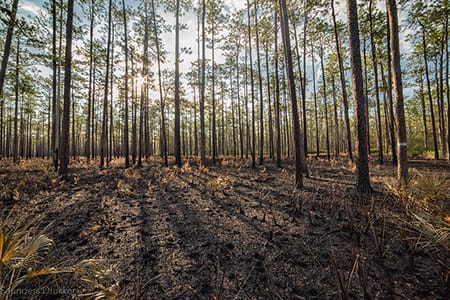
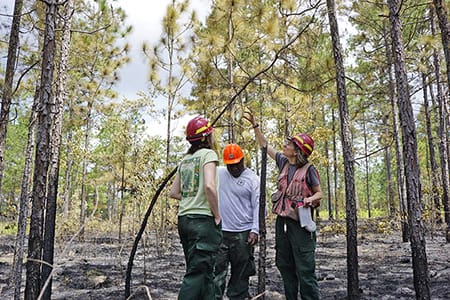
Josh Picotte (right) and Jason Drake (left) measuring a burn severity plot in the Apalachicola National Forest.
The specific goal of the study is to compare the accuracy of remote sensing of burn severity, using models that were developed at different spatial scales. So, one model was developed using all of the plots across the country using all fires, and others were developed with plots and fires within broad ecological regions, and others in smaller ecological regions, and so on. Models developed for local regions might be expected to be more accurate within those regions, but the tradeoff is that there are fewer plots to develop the model.
We found that, overall, models created for local regions are the most accurate, but there are exceptions, especially in regions where not many plots have been measured on the ground to calibrate the model. To help choose the best model for a particular fire, we created a “decision tree” to walk the user through the process of picking a model. Results of the research should provide an important advance in the ability of agency programs, such as Monitoring Trends in Burn Severity, to more accurately map burned areas. Maps of burned area and burn severity are important for many applications, including assessment of fire impacts on natural resources, creating national pollution emissions inventories, modeling the global carbon cycle to predict climate change, and monitoring the effects of climate change on trends in fire occurrence and effects.
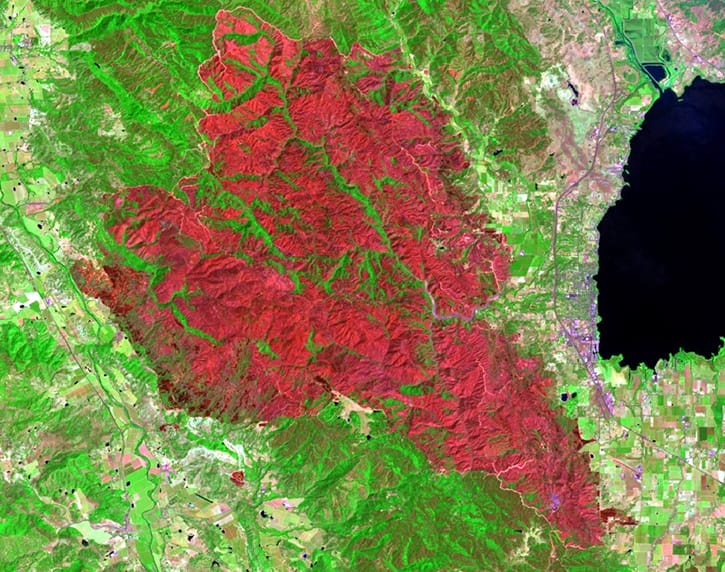
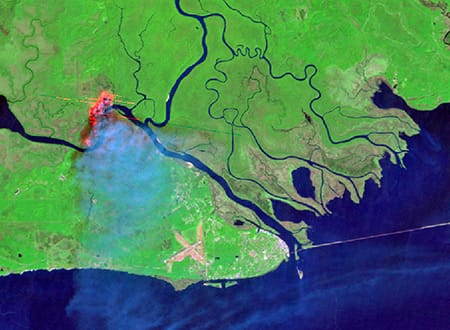
Burn severity map of the River Fire in northern California, 2018, with redder areas indicating higher burn severity.